Tuesday, March 31, 2009

April Fool Early Morning Short


Woke up at 8am, missed the Force 5 sell signal, but entered after it retraced. Nice short, TP at Monday fib level. In the H4 chart, EU showing it is continuing its downtrend after the gap filling yesterday and pullback to 38% fibo of the last week's swing low. Next support will be at 1.3100.

Today's strong resistance is at the confluence of Daily Open, Daily Pivot and 50% Fibo of previous day high low - 1.3255 area. Next Resistance would be at 1.3280 area with the confluence of Monday's High and Previous day 38% Fibo.

1 April 2009


Shorted at the lower high, hold the trade until it reach the Fibo level below.

Monday, March 30, 2009

31 March 2009


Shorted EU when it bounce of 38% Fibo and created a lower high.

Sunday, March 29, 2009

I am truly amazed by God

Habakkuk 1:5 (New International Version)

The Lord 's Answer
5 "Look at the nations and watch—
and be utterly amazed.
For I am going to do something in your days
that you would not believe,
even if you were told.

Trading Log 30Mar2009


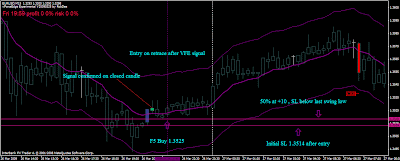
VFE Short Signal, enter on retrace with Force 5 sell signal.

Saturday, March 28, 2009

Trading Log 29Mar2009


The price reached a low of 1.3256. The successful test led to a move higher. The price peaked at 1.3298. The lows seem to be in place for the day and another move down will likely find profit taking buyers. Note however, that a move below the 1.3248 level should not be faded. A move higher would find resistance at the 1.3315-1.3323 level.

Next support at 1.3100 50% Fibo.

VFE


Trading Log - 29Mar2009

VFE Signal activated. entry on Force 5 signal.

Friday, March 27, 2009

Euro Bears


Trading Log -27Mar2009

2 losses shud have waited for higher low before entering.

Thursday, March 26, 2009

Slow Euro Day


Trading Log - 26Mar2009

1st trade of the day. Bounce of 50% Fibo retracement and MR3.

Duke Nukem 3D


This is the first PC game i have played!

Euro Bull Flag


Trading Log -26Mar2009

Euro H4 bull flag formation is on everyone's mouth. Potential break up~

Wednesday, March 25, 2009

Euro


Trading Log - 26Mar2009

Possible short entry here.

Wall Street Fighter


Very interesting and funny video~

1st trade in Oanda

Trading Log -25Mar2009

Today i did my first trade in Oanda ( like a Virgin), Short 1,000 units. Profit only USD0.02.
I was feeling the price wont go my way, so closed it with a small profit.

50% Fibo Bounce


Trading Log - 25Mar2009

50% Fibo bounce and after 5 inside bars, 1 bar close below the bull candle. Signal to short.

Scalp


Trading Log -25Mar2009

Scalp +10

Tuesday, March 24, 2009

Euro Daily Fibo


Trading Log - 25Mar2009

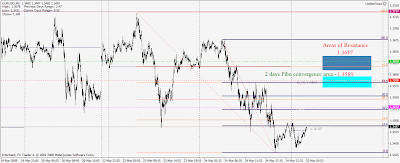
Areas of Resistance for today are marked in the charts. Look out especially for area 1.3583.

Oanda

10:00pm - Got my Oanda Account Approved at 10:00pm today.

1:43 am - Bought USD100 for my Paypal account through my friend.

2:43 am - My USD100 has been credited to my FXTrade Account. Current balance:USD96.80. USD3.20 as Paypal Fees.


I will start live on Oanda next week to try its trading platform. Paypal funding fast and efficient.


Euro Bounce


Trading Log - 25Mar2009

A good short entry.
Upper TL resistance, previous support turn resistance, 50% Fibo.

Hang Out with my FX mentor

Today, there was an impromptu meeting, Xenos (www.pipspassionblogspot.com) and I met up with Sky (www.skypips.com) at Summit USJ.

Sky shared his personal trading experience with us, a really helpful and Awesome mentor to me!

Tomorow, Me aka Fibo Dido will be testing Fibo Convergence Technique and Fibo Projections.
Had my Oanda account approved, will try using it, 0.9 pips spread on EUR/USD.

FXDD Candy


I got a gift from my friend today, it was a candy box with Dollar Signs Candies in it.
Its a candy box from FXDD, one of the few good FX brokers around.

Trading Desk


"My Trading Desk"

Fibo & DO Bounce


Trading Log - 24Mar2009

Bounce of 50% Fibo and DO with a Double TOP!!

Euro 24March


Trading Log - 24Mar2009

Euro hit 38% fibo resistance.

Monday, March 23, 2009

Fibo Dido


Preface

Fibonacci Retracements are probability points where a currency, or stock will "bounce back" to, after a large move, and then continue in the original direction. Think of Retracements in terms of Newton's Laws of Motion: "For every action there is an equal and opposite reaction."

Fibonacci in Forex - The Self Fulfilling Prophecy

All of the magical math in the world will never make Fibonacci retracements true 100% of the time. Period. Thus, a little common sense goes a long way when using any type of mathematical, or technical indicator to trade from. If the market is showing something different than the indicator, enough people believe in something different that the indicator is wrong. Fibonacci retracements are only good so long as enough people are watching and acting on the same information that the collective whole makes the occurrence a self-fulfilling prophecy. What I'm saying is that even if you've opened a trade based on Fibonacci retracement expectations, be prepared to close the position, should common sense warrant such.

With the aforementioned in mind, Fibonacci Retracements work on both short and long-term time frames for all types of traders. For this article, we will only look at short-term trading with 4-hour charts.

First, before we even consider a Fibonacci retracements, you need to be able to spot when a move has occurred that would warrant using Fibonacci Retracements. This can be as simple as looking at a chart, and visually seeing that a large move has transpired - and capitulated. What I mean by this is, if when looking at a chart you're expecting to see empirical proof that a move has stalled, you will never be able to do so. You will see some signs, like MACD or Stochastics bottoming out, or a candlestick pattern like a hammer bottom, but you will never know for sure. One way to have a slight bit of assurance though, is to look for candlestick confirmation, something I recently covered in my article Why Confirmation Counts.

Regardless, only countless hours of pouring over charts will give you 'the feel'. Once you are able to infer a move is over, you can begin to apply Fibonacci retracements for profit targets points if you are trying to trade the rebound, or for new entries, if you are waiting to get back into the currency, for a continued move in the same direction, as the previous 'large move.'


Fibo Bounces


Trading Log - 23Mar2009

DB at Fibo and bounce.

Bear Flag Part 3


Trading Log - 23Mar2009

Awesome textbook trade. Projected target hit!!

Scalp


Bear Flag Part 2


Trading Log - 23Mar2009

A textbook trade.

Bear Flag


Trading Log - 23Mar2009

Shorted this Bear Flag formation.

Fibo Bounces


Sunday, March 22, 2009

Dealbook 360 by GFT Forex


Trading Log - 23Mar2009

Playing around with Dealbook 360 today.

Friday, March 20, 2009

Fibo Bounces

Fibo Bounces- Sky's Fibo Scalping Teachnique (SFST)™


Trading Log - 20Mar2009

Practicing Fibo Bounces the whole day.

Thursday, March 19, 2009

Wednesday, March 18, 2009

FOMC

Wolfe Wave


Trading Log - 18Mar2009

Wolfe Wave prediction hit.

Tuesday, March 17, 2009

Stick to the rules

30 pips loss today. Did not adhere to my rule in waiting for S/R confirmation before getting into a trade.

News Trade


Trading Log -17Mar2009

Entry on the 50% Fibo of the news spike and last swing low.
Price filled the wick and broke through it.

Monday, March 16, 2009

Risky Trade


Trading Log - 16Mar2009

Took a risky BUY here, but paid off after it broke 1.3000.

Euro 1.3000

Just have a hunch Euro wont touch 1.3000.

Edit: I am so WRONG!

Euro Channel


Trading Log -16Mar2009

Price has hit the upper channel.

RPP Line (New Indicator)


Trading Log - 16Mar2009

Tested my new indicator line - RPP. Today price bounced of the RPP line! Gonna continue testing it.

Saturday, March 14, 2009

FX Options

I reckon there will be traders betting on the EUR/USD reaching 1.3000 in FX Options.

What is FX Options?


Forex Options allow you to customize your options including payout amounts, barrier prices and expiration dates. These customizable features put you in full control of your risk. Depending on the option that you select, as long as the criteria behind your barrier prices are met, you will receive your payoff amount. If not, all you can lose is your predetermined option premium.

SPOT options allow you many choices:
  • Standard options.
  • One-touch SPOT – You receive a payout if the price touches a certain level.
  • No-touch SPOT – You receive a payout if the price doesn't touch a certain level.
  • Digital SPOT – You receive a payout if the price is above or below a certain level.
  • Double one-touch SPOT – You receive a payout if the price touches one of two set levels.
  • Double no-touch SPOT – You receive a payout if the price doesn't touch any of the two set levels.
I say this again: I reckon some people will be betting EUR/USD to touch 1.3000 (One touch spot) If price reach 1.3000 u will get paid.

This is called gambling!!

Speculative Hot Money move


Trading the Price Action

Real money move PA Pattern (Staircase)

Shorts are holding onto position expecting lower levels; move likely to have long term impact.

Speculative Hot Money move

Sharp one sided move followed by slow retracement of the entire move. Typical speculative PA. Short term traders go for quick profits, long term effect not likely.

New S/R Line


New indicator for Force system in testing period

Starting next week i will incorporate a single S/R line in my charts where Forex Dealers use.

I will test its efficacy and to know whether it is self fulfilling.

Hope this single S/R line will help enhance the Force system.

Stay tuned.

Force Entry

What do we do when there is a Force signal?

First check whether its at a Support/Resistance level.
Wait for a Double Top/Double Bottom.
If there is no DT/DB?

Robdee:I agree doubles forming on S/R levels are easy to see and easy to trade. What do we do when there is no double ? We have to look for trendline or fibo (tests, retests, breaks, fake breaks, bounces, rejects) that kind of thing, a lot trickier to get right imo. The good news is the 5min chart is typically rather good for "clear open V shaped doubles" that you cannot see on higher TFs.

Friday, March 13, 2009

Perfect


Trading Log - 13Mar2009

Perfect bounce today with a perfect candlestick pattern. This trade is straight from the textbook man!

Wednesday, March 11, 2009

Euro Rising Channel


Trading Log - 12Mar2009

EU is in a rising channel now.

Euro Bulls 12March


Trading Log - 12Mar2009

Euro Bulls supported by a lower TL. Morning star pattern at the MP resistance turn support provided an opportunity to add position on the bull run.